
Analyzing Subsaharan Fires
the forest is burning
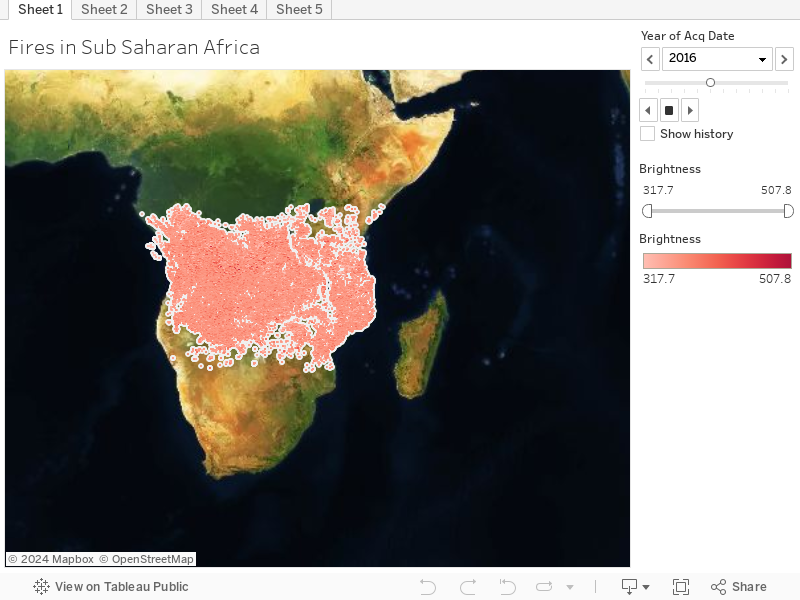
Over the past couple decades, wildfires, both natural and unnatural, have been burning across the Congo Basin and surrounding area. In this project we hope to dig deeper into the root causes and possible larger effects it has on the environment and climate as a whole.
Data critque
insights and analysis

Fires last year 2021
congo rainforest acres lost*
What are Our Research Questions?
1. Why are there so many fires in Sub-Saharan Africa?
2. Are the fires related to climate change or agricultural activity?
3. What trends have the fires taken over the past decade?
See Why the Forest is Burning
what are the hidden causes and global effects
Explore our Project
Feel free to browse the different sections to learn more about the Congo Rainforest and its relationship with fires.
Data critque
See our process of acquiring data and methods to analyze
insights & Analysis
What are the implications of the data and its larger context.
about
Learn more about the team including biographies and photos.
sources
See where our sources came from and how they contribute to the project.
Meet the Team

Zachary mcnelley
Is a senior Computer Science major who created the website and non-data related graphics. Contributed to fleshing out the overall narrative and making sure the data/insights fit together in the context of an interactive website.

taiyo keilin
Taiyo Keilin (fourth-year statistics) served as the main author and editor of the content and narratives for our project. As one of the many statistics majors in the group, he also helped out with the data visualizations and making sure the narratives fit the data, not the other way around.

yao zhang
Yao Zhang (fourth-year statistics) served as the data cleaner and assisted Jong with the data visualizations. He also discusses with group members with project questions, and gives some advices. Yao also help with the visualization description.

kent zhang
Kent Zhang (fourth-year computer science) served as primary data collector and cleaner. He primarily did data acquisition and also did initial cleaning on our datasets through python. Kent also contributed to the data critique write up.

jong hyun cha
Jong Hyun Cha (fourth-year statistics) served as the project manager and head data visualization creator of the project. He distributed work amongst the group members, while making sure the project stayed on track with deadlines. Jong also took charge in creating the maps, scatter plots and other graphics for descriptive analysis.
*Source New York Times How Demand for Twigs is Bringing Down a Rainforest https://www.nytimes.com/2022/07/13/climate/congo-river-basin-deforestation-charcoal